
Financial Strategy
Growth into a Global Specialty Pharma through Strategic Resource Allocation
Our company aims to grow into a “Global Specialty Pharma” delivering innovative medicines to patients worldwide. To achieve this, our financial strategy is not merely about reaching numerical goals, but plays the role of “strategic resource allocation” directly linked to the realization of our management vision. Under top management by our executive team, we are building a system that balances financial soundness and growth, by making investment decisions based on capital efficiency indicators such as ROIC (Return on Invested Capital). In FY2024, through the acquisition of Deciphera, which has strengths in oncology in the U.S., we have achieved geographical diversification and expanded our business model as growth drivers. At the time of acquisition, Deciphera had global sales track records for its products and held one new drug candidate under regulatory review in the U.S. and Europe, plus three additional new drug candidates in development. The acquisition of Deciphera greatly contributed to our growth strategies of “Realization of direct sales in the U.S. and Europe” and “Reinforcement of pipelines.” Based on the Deciphera acquisition, we have updated our growth strategy to “Expansion and acceleration of direct sales in the U.S. and Europe,” and by leveraging Deciphera’s capabilities, we aim to achieve further corporate growth. We anticipate Deciphera’s turnaround to profitability in FY2027, continuing efforts to ensure that the success of the acquisition translates directly into enhanced overall corporate value.
Overview and Progress of Financial Strategy in Growth Strategy
Ono’s Financial Policy
●Emphasizing Capital Efficiency and Financial Soundness
Emphasizing Capital Efficiency and Financial Soundness We use capital efficiency indicators such as ROIC and ROE, and pursue profitability that exceeds our capital cost (around 6%). We prioritize mediumto long-term value creation over short-term profits.
●Execution of Strategic Resource Allocation
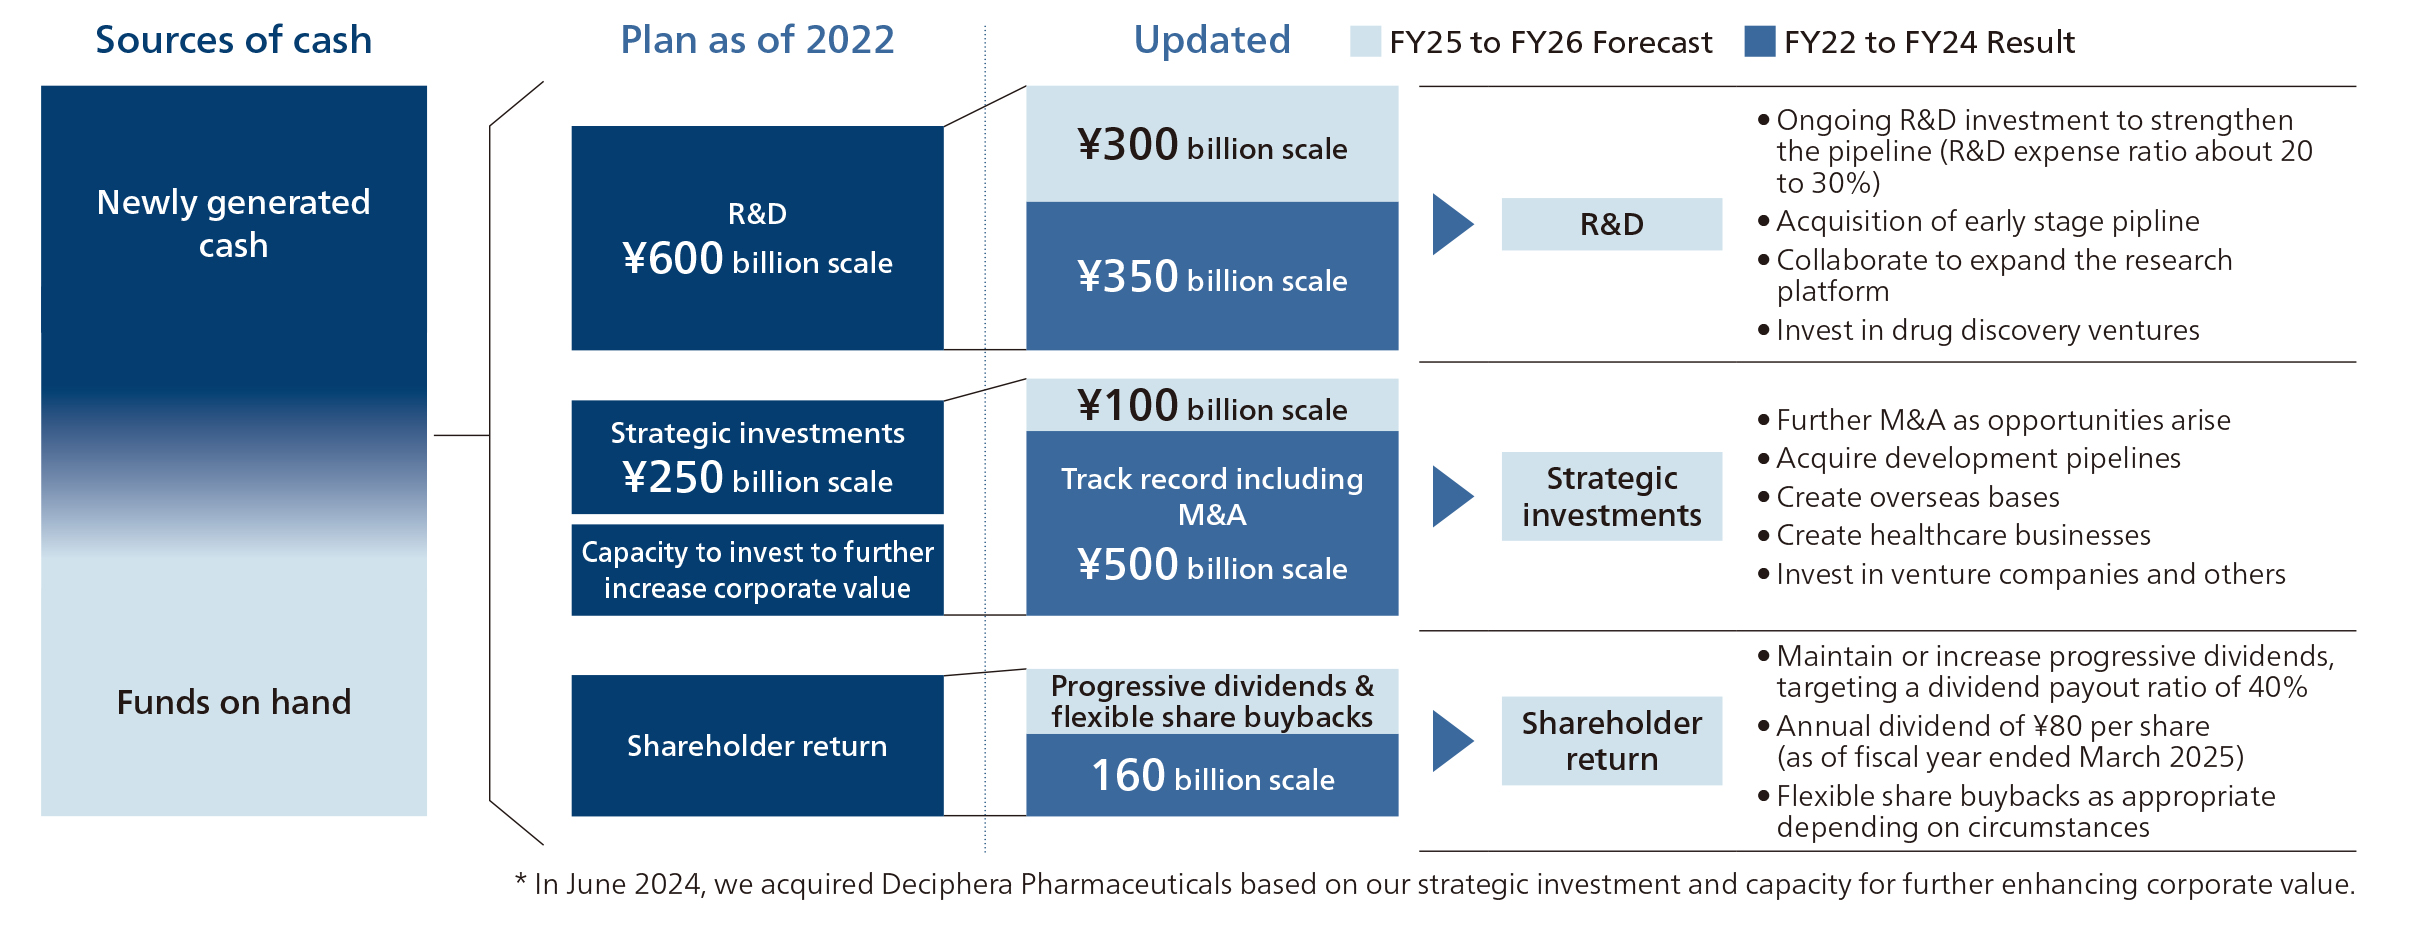
We invested approximately ¥850 billion (¥350 billion in R&D + ¥500 billion in strategic investments) from FY2022 to FY2024. We plan to invest a total of approximately ¥400 billion in FY2025 to FY2026 as well.
●Shareholder Return and Capital Structure Optimization
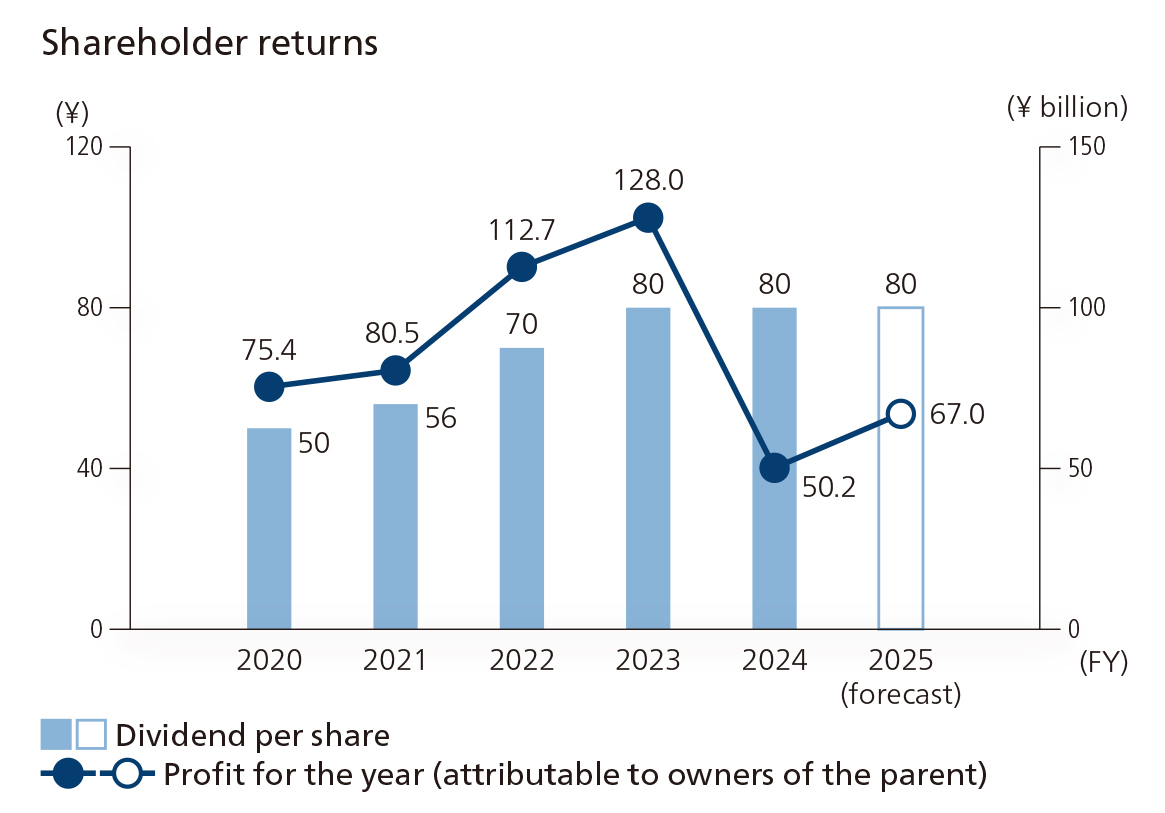
With a progressive dividend policy (2025 forecast: ¥80 per share), we will reduce the ratio of cross-shareholding.
Overview of Growth Strategy
●Accelerate Global Expansion
Through the acquisition of Deciphera, we have expanded our direct sales structure in the U.S. and Europe. Profitable turnaround expected in FY2027, which is anticipated to be a medium- to long-term growth engine.
●Focused Strengthening of R&D
By integrating our own drug discovery and acquired assets in oncology, immunology, and neurology, we aim to improve efficiency and success rates. Several products are in the final stages of development toward FY2025.
●Flexible and Dynamic Strategic Evolution
We regularly review our growth strategies and incorporate external growth such as M&A to ensure flexibility and scalability, advancing toward becoming a Global Specialty Pharma.
Growth strategy targets (FY2022–2026)
|
|
FY2021 result |
FY2022 result |
FY2023 result |
FY2024 result |
FY2025 forecast |
FY2026 target |
|---|---|---|---|---|---|---|
|
Revenue (¥ billion) |
361.4 |
447.2 |
502.7 |
486.9 |
490 |
Revenue CAGR* |
|
Operating profit margin |
28.6 |
31.7 |
31.8 |
12.3 |
17.3 |
Maintain 25% or higher |
|
R&D expenses (¥ billion) |
75.9 |
95.3 |
112.2 |
149.9 |
150 |
ー |
|
R&D expense ratio (% of revenue) |
21 |
21.3 |
22.3 |
30.8 |
30.6 |
20-25% |
*Compared to FY2021
Advancements in Cash Allocation
Over the three years from FY2022 to FY2024, Ono Pharmaceutical invested approximately ¥350 billion in R&D expenses and about ¥500 billion in strategic investments. For the next two years, FY2025 to FY2026, we anticipate investing about ¥300 billion in R&D and approximately ¥100 billion in strategic investments such as M&A and pipeline acquisition. These investments prioritize mediumto long-term value creation over securing short-term profit. Our cash allocation policy is to “pursue growth returns that exceed ROIC” and “balance this with financial soundness.” With respect to acquisitions, although the upfront acquisition costs were substantial, in exchange, we have acquired stable, long-term cash flows as well as difficultto-quantify positive elements such as strengthened sales infrastructure, development infrastructure, and R&D capabilities. These enhancements have also contributed to greater negotiating power in global license deals.
Updated investment allocation (FY2022 to FY2026)
Shareholder Return and Improved Capital Efficiency
At our Company, securing profitability above the cost of capital and improving capital efficiency are positioned as important management indicators, and we are working continuously to improve ROE. Currently, we estimate our cost of capital to be around 6%, and, in FY2024, we managed to secure an ROE just above that level. For FY2025, which is underway, ROE is expected to reach 8%, ensuring profitability that exceeds the “minimum capital cost level” sought by domestic and international investors. However, management is not satisfied with this level, and we are aiming for ROE above 10% in the medium to long term. In particular, if the ongoing M&A of Deciphera is successfully monetized, we expect an even higher level from FY2027 onward. On the other hand, it is not easy to dramatically improve profitability in the short term, and the impact of capital policies such as share buybacks on ROE is limited. Therefore, while aiming for more substantive improvements in profitability, our Company clearly states its “progressive dividend policy,” clarifying our commitment to providing long-term returns to shareholders. This stance has been highly praised particularly among individual investors and helps strengthen trust with investors. By thus advancing our growth strategy and increasing income gains, we aim to sustainably enhance corporate value, boost market evaluations, and increase TSR. Additionally, as part of our efforts to improve capital efficiency, we have been actively reducing cross-shareholdings, and in FY2024, we achieved our goal of reducing the ratio of cross-shareholdings to net assets to less than 10%. We will continue to reduce cross-shareholdings after FY2025 and strive to enhance corporate value by reallocating capital toward growth investments.
We are working on this for the following reasons:
・ Cross-shareholdings are a factor in lowering ROE and ROIC
・ Increasing calls from shareholders to improve capital efficiency
・ Stewardship Code and Corporate Governance Code recommend the sale of shares for which there is no rational reason to hold them.
Going forward, while thoroughly managing with an awareness of the cost of capital, we will continue to strengthen shareholder returns through both dividends and capital policies.
|
Fiscal year |
2020 |
2021 |
2022 |
2023 |
2024 |
2025(forecast) |
|---|---|---|---|---|---|---|
|
Total dividends(¥ billion) |
25 |
27.7 |
34.2 |
37.9 |
37.6 |
37.6 |
|
Payout ratio(%) |
33.1 |
34.5 |
30.3 |
30 |
75.1 |
56.1 |
|
Share buybacks(¥ billion) |
- |
30 |
- |
50 |
- |
Undecided |
|
Total return ratio (%) |
33.1 |
71.6 |
30.3 |
69.1 |
75.1 |
Undecided |
Capital Cost and Capital Profitability
We are working on the following measures about Action to Implement Management that is Conscious of Cost of Capital and Stock Price.
Understanding Capital Cost
We use the cost of equity capital as our capital cost.
Analysis and Evaluation
For FY2025, we estimate our cost of equity capital to be approximately 7%, while our return on equity (ROE) was 8.5%. As our ROE exceeded our estimated cost of equity capital, we evaluate that a certain level of capital profitability was achieved during the fiscal year.
We also closely monitor market valuation indicators, including the price-to-book ratio (PBR), which reflects market expectations for future growth, and continuously assess how the market evaluates us. In addition, we seek to enhance capital efficiency through the optimal allocation of management resources, thereby further enhancing corporate value. With a focus on the cost of capital, capital efficiency, and market valuation, we are pursuing growth strategies to achieve the sustainable enhancement of corporate value. We aspire to be a global specialty pharma that continues to deliver innovative medicines to patients around the world.
To this end, we actively acquire promising pipeline assets and innovative technologies from external sources while advancing our own research and development activities, supported by resources generated through maximizing the value of our existing products.
Furthermore, through the acquisition of Deciphera Pharmaceuticals in June 2024, we have strengthened our global development capabilities and are accelerating the expansion of our global business by increasing sales of QINLOCK and ROMVIMZA in the U.S., Europe, and other markets. Several important pipeline assets, including VELEXBRU, sapablursen, ONO-4578, and ONO-2808, have progressed to the regulatory submission stage or late-stage development pipeline, further strengthening our long-term growth foundation.
We intend to conduct global clinical trials, obtain regulatory approvals, and maximize product value in major markets, including the U.S. and Europe. In addition, we are promoting sustainability initiatives aimed at contributing to a sustainable society through our business activities.
Ongoing Initiatives
We will continue to pursue management practices focused on capital cost, capital efficiency, and market valuation, while striving to enhance information disclosure and dialogue with investors. These initiatives are regularly analyzed and evaluated by the Board of Directors.
For further details, please refer to our Integrated Report.
Integrated Report (Financial Strategy)
Refer to pages 53–56 for more information.
Indicators (Actual Results)
*After Tax %
|
Indicators |
2020 |
2021 |
2022 |
2023 |
2024 |
2025 |
|
|---|---|---|---|---|---|---|---|
|
Capital Cost |
Cost of Equity Capital* |
Approximately 6% |
Approximately 7% |
||||
|
Capital Profitability |
ROE |
12.6% |
12.5% |
16.1% |
16.7% |
6.4% |
8.5% |
|
Market Evaluation |
PBR |
2.27x |
2.28x |
1.82x |
1.45x |
0.96x |
0.99x |